In this tutorial, the output characteristics of a NPN transistor will be measured. A plot of collector current IC versus collector to emitter voltage drop VCE with base current IB as a parameter will be displayed.
It is assumed that the transistor is connected to the Test Fixture as shown below:

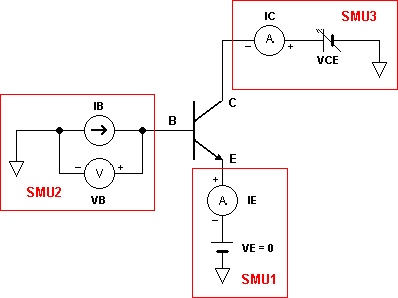
where the emisor E is connected to the SMU1, the base B to the SMU2 and the colector C to the SMU3.
A schematic representation of the circuit according to the experimental setup is:
To start measurements push the on/off button in the front panel device. The MENU PAGE will be shown:
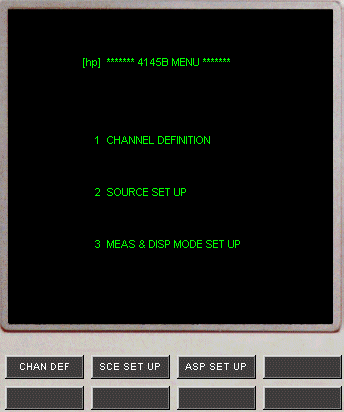
Press the NEXT button button or the CHAN DEF softkey to change to the CHANNEL DEFINITION PAGE:
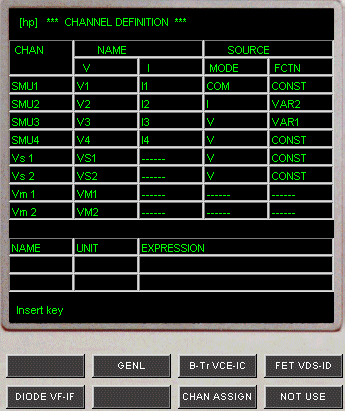
Fields have to be filled or modified with the names used in the previous schematic. Depending on the field the softkeys or the panel keys must be used. A message in the bottom of the screen helps to select the correct option.
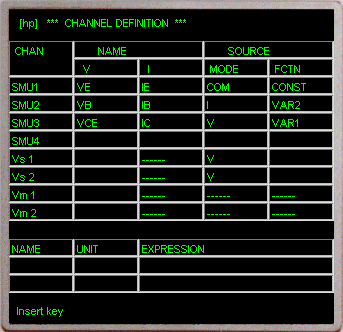
For SMU1 a source mode COM is selected because VE=0 (see schematic). SMU2 is set as a current source I, and assigned as function VAR2, the secondary sweep, in order to obtain a IC vs. VCE curve for each IB value. SMU3 is set as a voltage source V, and assigned as function VAR1, the main sweep.
Press the NEXT button to change to the SOURCE SET UP PAGE:
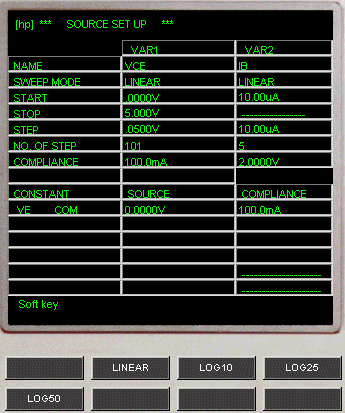
For VAR1 a LINEAR SWEEP mode is selected, varying VCE from 0 to 5V with a 0.05V step. For VAR2 a LINEAR SWEEP mode is also selected; 5 steps of 10uA are programmed, starting at IB=10uA.
Press the NEXT button to change to the MEAS & DISP MODE SET UP PAGE:
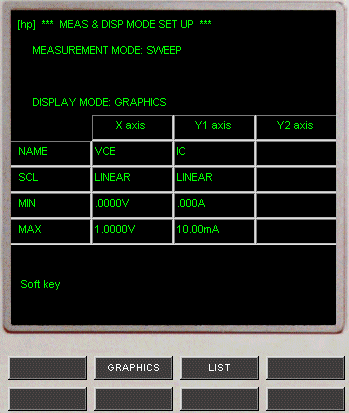
To show the graphic representation of the measurements select the GRAPHICS softkey.
Move the cursor to VCE - MAX field and change the value to 5V.
Press the NEXT button to change to the GRAPHICS PLOT PAGE:
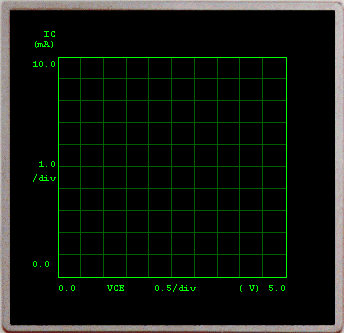
To start the measurement process press the SINGLE button:
The MEASURING led lights while the measurements are performed. At the end of the process, the plot is displayed.
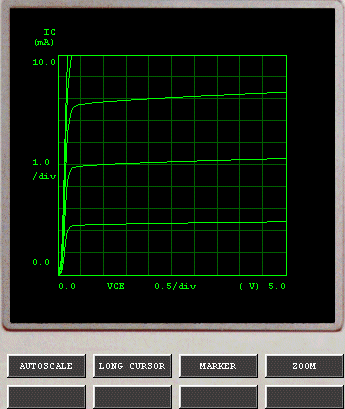
Selecting the AUTOSCALE softkey, the graphic is redraw using a new automatic axis adapted to the measurement values.
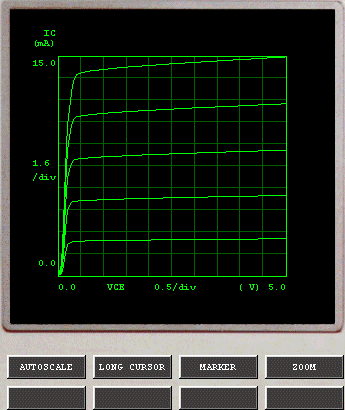
Selecting the MARKER softkey, a w is shown in the origin. Drag with the mouse the MARKER dial in the front panel and rotate it. The mark w will move along the plotted curves.
The coordinates of the marker location are displayed above the plot area.

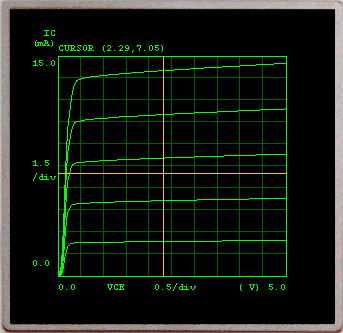
Selecting the LONG CURSOR softkey, a cursor is displayed in the graphic area. The cursor position can be changed with the mouse movement.
The coordinates of the cursor location are displayed above the plot area.
Press the PREV button to return to the MEAS & DISP MODE PAGE SETUP.
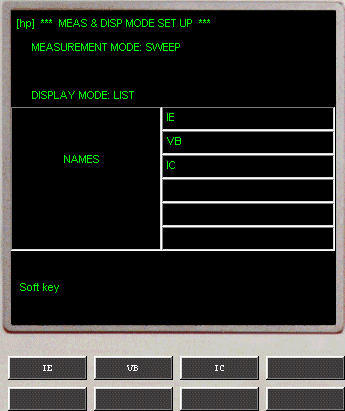
Selecting the LIST softkey, the LIST DISPLAY Setup PAGE is displayed. Press the three available softkeys to select the monitor channels whose values will be listed.
Press the NEXT button to change to the LIST DISPLAY PAGE.
Select the SINGLE button to start the measurement. At the end of the process, the values are listed.
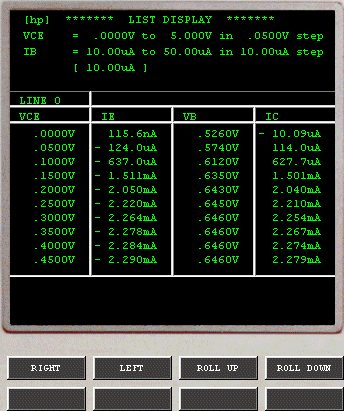
Only ten lines can be displayed. To display aditional lines, use the ROLL UP or ROLL DOWN softkeys.
Pressing the SAVE button, it starts the process for storing the measurements in a local file of your computer:
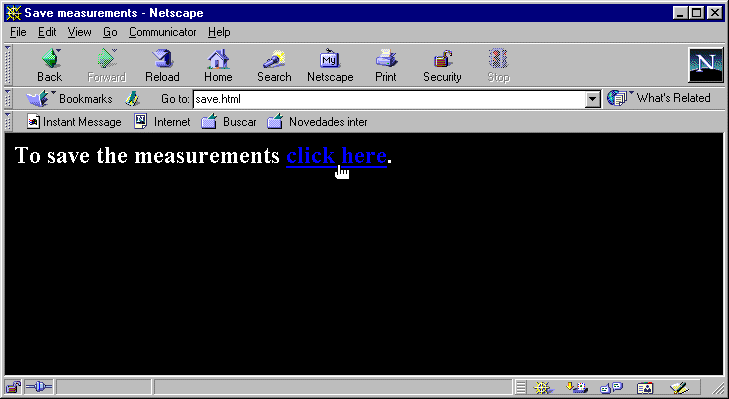
Press the link that is in the html document. The measurement values will be displayed in a new window.
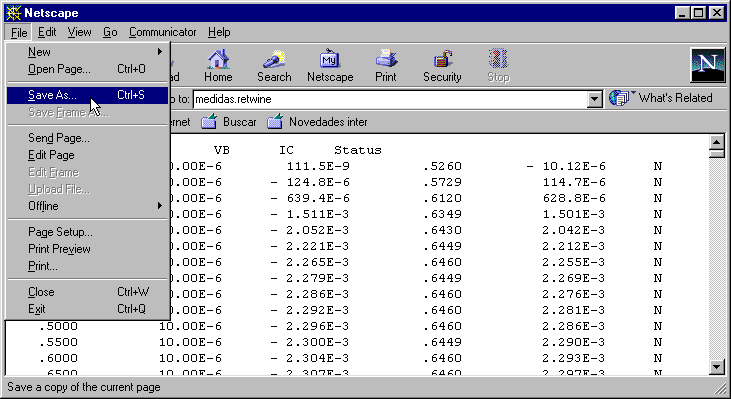
Selecting the option Save as... in the File menu, the measurement data will be stored in a local file.
This ASCII file can be used by other programs.